

Hey Friends🖐️,
I have a confession. I spent years making products for millions of people without knowing if they were profitable. When I asked teammates, no one really knew the whole picture either. Sure finance knew about headcount, engineering owned the BOM, and product worked on LTV. But what about an end-to-end story?
As I learned more about the variables, it became intimidating. MVA, tariffs, distribution channels, gross profit, Op Ex, and NRE. How does it all come together?
Great products are user desirable, technically feasible, and business viable. The last part is something that often gets left behind. Today we’ll talk about a framework for making financial models for physical products.
Background
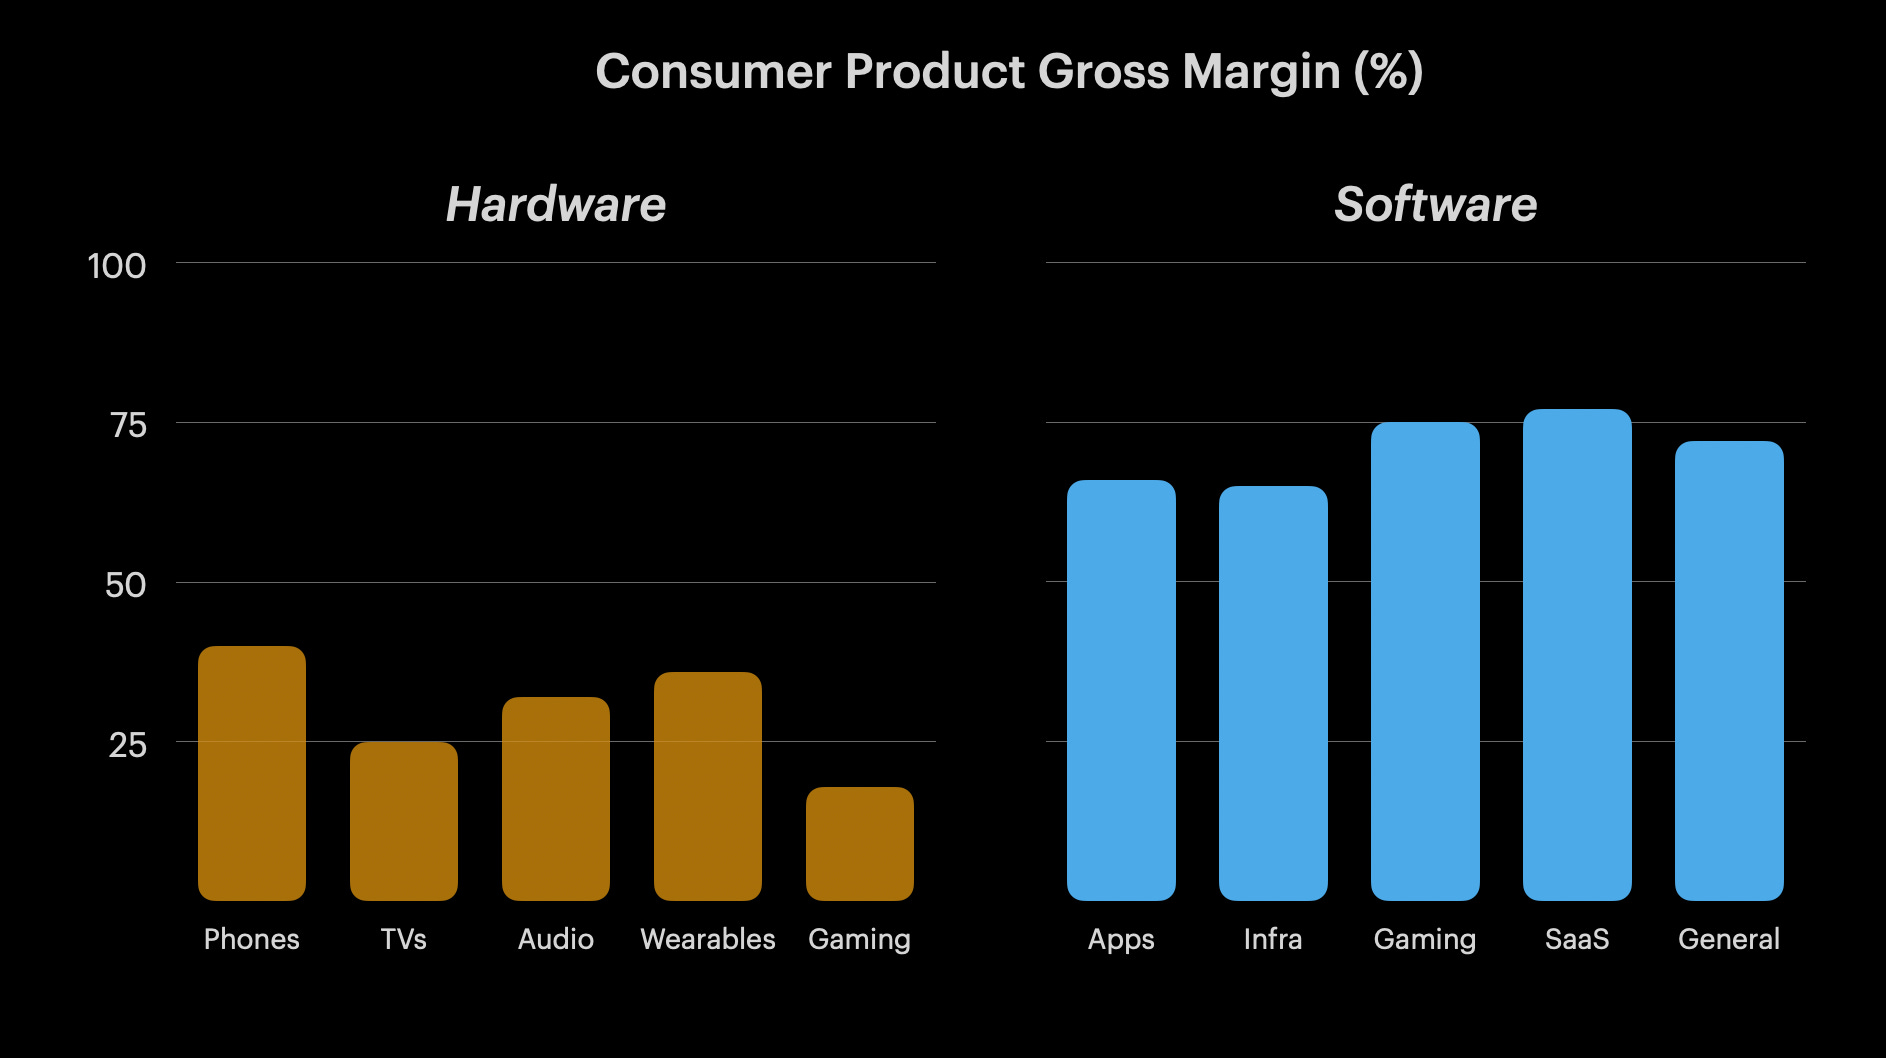
Lets level set before we dive into the material. On average, gross margins for physical devices range from 20-45%. There are industries with even lower margins, such as automotive, with 4-7% returns. Software products in contrast yield profits between 60-70% in general.
One of the most significant costs in making hardware products is BOM (material cost). Just look at how many components go into an iPhone 16 and the allocation of each.
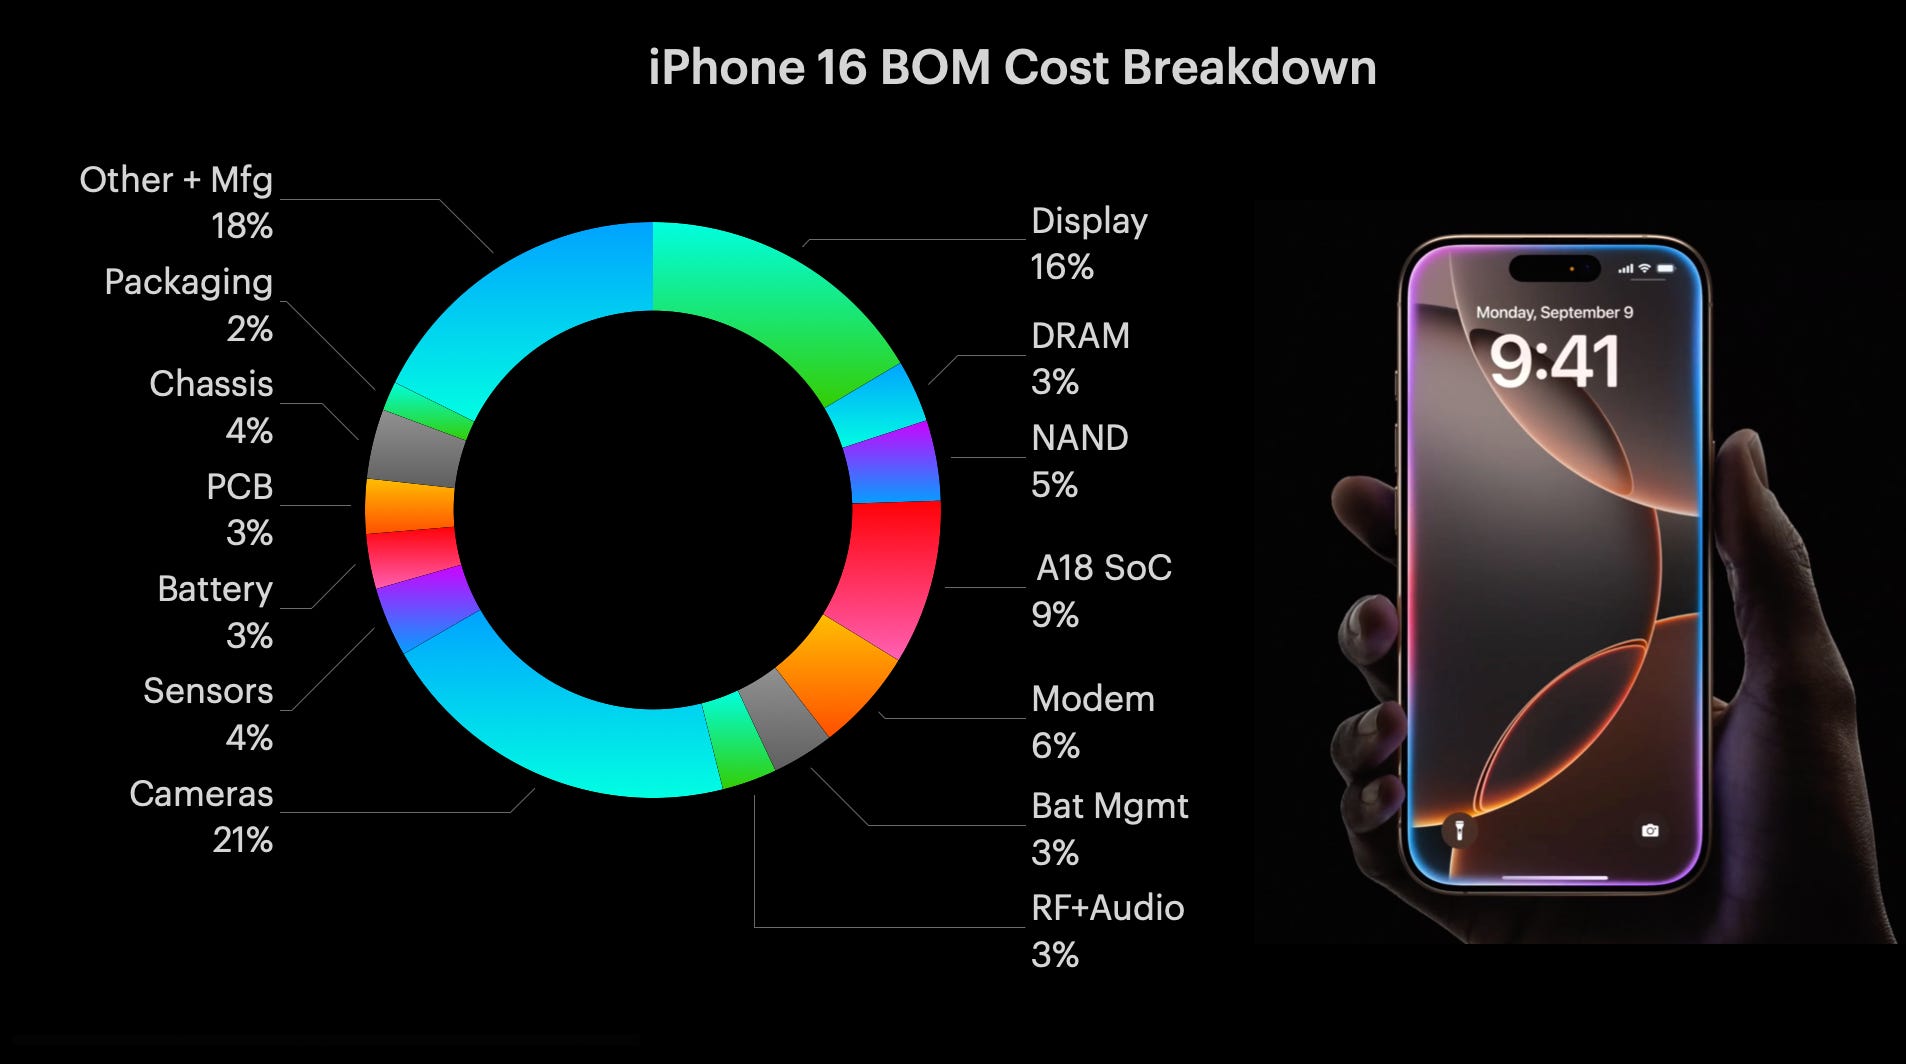
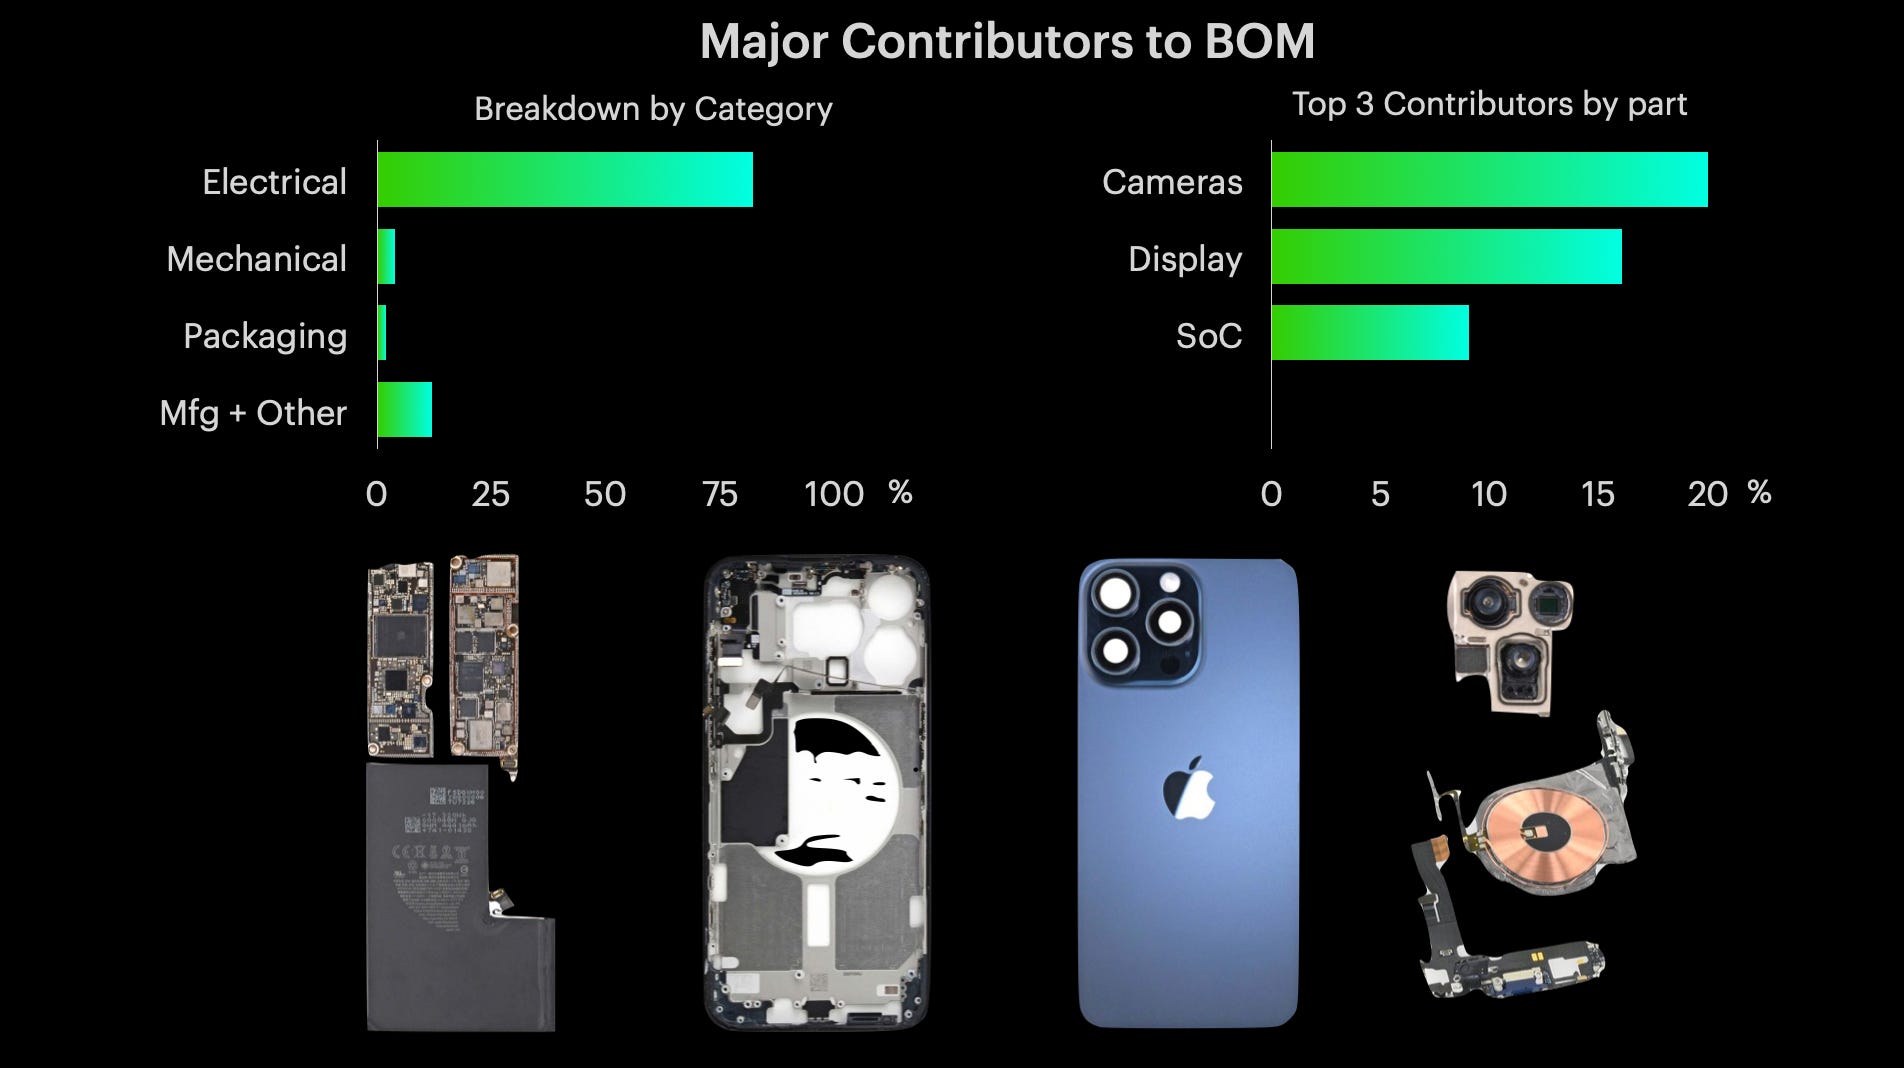
The top cost contributors are electrical parts such as cameras, processors (SoC), and displays. This trend is true for most consumer devices, whether it’s in wearables, smart home devices, or IoT products.
Why is any of this relevant to us as product builders? Because it ensures we know what we’re getting into when evaluating new initatives. It clarifies where to focus efforts in product architecture or concept discussions.
The charts above indicate that physical devices won’t yield the same scale of returns as software, and BOM cost efficiency (in general) comes from prioritizing electrical components.
🤔Interested in learning 0-1 HW Product Management?
Our readers have been requesting a practical guide to taking a hardware idea from concept to mass market.
We’ll be covering principles including HW product sense, business feasibility, go to market planning, user desirability, and technical viability.
Our goal is to help beginners or even experienced product makers sharpen their craft. Drop your email below for access to initial modules and early bird pricing.
Disclaimers & Assumptions
Before we start,
I’ll be creating a hypotehtical scenario in this post. Please don’t use any material as ground truth for your product lines.
This content is from the perspective of a HW device product manager. Feel free to state insights in the comments from your respective backgrounds (as supply chain managers, engineers, founders, etc.).
I framed the model from a medium sized company’s view point. Looking at it through a startup’s lens would introduce too much variability (funding, investors, volumes, capital) to provide meaningful guidance.
✍️Course Starts Here
Imagine you’re a product manager at a smart thermostat company, tasked with defining the financial model for the next flagship product - the HeatSync Pro. It’s a premium smart thermostat that combines climate intelligence with elegant design.
In an earlier post we talked about how to define product requirements for such a product. Now it’s time to get into the financials as the next step in our product development process.

Step 1: MSRP
Determining the retail price is a bit of a science. We know that companies provide perceived value to customers in the form of a product. That value is exchanged for a price.
Pricing can be set by adding a certain amount to the cost of each item (cost-based), adjusted by how much consumers are willing to pay if it’s a higher-perception brand (value-based), or set based on competitors (market-based).
For our example, since the smart thermostat market already has established pricing tiers for premium products (Google Nest), we’ll use market-based pricing and settle on $250.
Another strategy could have been to implement penetration pricing, where initial prices are lower to beat competitors.
Any pricing assumptions can be validated through surveys, A/B tests, or conjoint analysis studies, where we can objectively measure how much customers value individual features in a given product line.
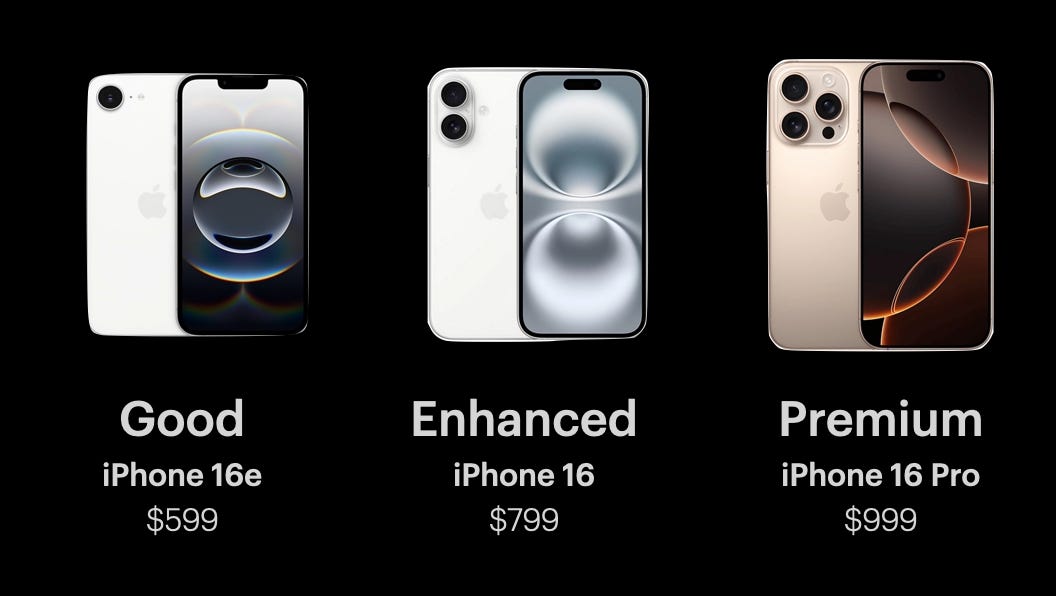
Pricing can also be adjusted using versioning, which involves developing configurations at varying tiers to serve more consumer segments. This helps companies maximize revenue by capturing value from budget-conscious consumers to high-end users. The enhanced/mid tier is the one that usually sells the most volume. This tiering also psychologically positions people who are undecided about a purchase to go with the mid-tier product as it is more affordable than premium options but still has better features than the entry/good tier.
Step 2: Volume
This is the number of devices a company wants to sell over a time period (3-5 years). Determining the number involves forecasting demand from your target market, competitive benchmarking, and considering adoption rates. This needs to be balanced with production capacity and cash flow constraints.
For our example, let’s use 300K units over three years. This can be a relatively low volume for a smart home product sold by a medium-large company, but it fits the premium tier. Lower to medium priced products typically sell in the millions of units.
Step 3: Average Selling Price (ASP)
The average selling price is the actual price at which a product sells for over time. MSRP is just a benchmark. This is because we have to take distributors and promotions into consideration.
3.3 Identify Distribution Channels
To calculate ASP, first we need to determine how the product will be distributed. For our example, let’s assume:
80% of units are sold directly online
20% are sold via Amazon
3.4 Identify Price Per Channel
Direct: $250
Non Direct: $200 because Amazon will take a hypothtical 20% cut.
3.5 Identify Discount Rates
Next let’s identify how our price is impacted by promotions. The basic premise of promotions is to enhance revenue in the long term, through offering temporary reductions to make a product more attractive. Frequency is how often there is a sale, and amount is the value of the discount. I’m using the words promotion and discount interchangeably here but they are different.

3.6 Identify Price After Discounts
Direct: $250 × (1 - 3%) = $242
Non Direct: $200 × (1 - 5%) = $190
3.6 Identify Average Selling Price (ASP)
ASP = (Direct Price after Discount × % of Units Sold Directly) + ( Non Direct Price after Discount × % of Units Sold Non Directly)
ASP = $242 × 80% + $190 × 20%
Average Selling Price = $232
Note how our ASP is $232 versus the MSRP, which is $250. This will be important for net revenue calculations.
Step 4: Returns
Don’t forget to factor in returns. Lets assume 3% of units will be returned. This number varies within products and industries.
Return Value (RV) = Units Returned × ASP
RV = 300,000 × 3% * $232
RV = $2,088,000
Step 5: Net Revenue
Net revenue is the actual income for a product line after sales and deductions. Notice how ASP is used, not MSRP.
Net Revenue = (Units Sold × ASP) − Return Value
Net Revenue = (300,000 * $232) − $2,088,000
Net Revenue = $67,512,000
Step 6: BOM (Part of COGs)
COGs refers to the cost of goods sold, essentially the total direct cost to make a single unit. Part of COGs is BOM, which is the material cost of each component (plastics, metals, chips, batteries, and more).
BOM is the largest contributor to per unit cost, hence why it's so important to optimize. As stated in the iPhone example above, the top contributers to BOM are usually electrical components.
So how do you reduce BOM cost?
There are many ways, but the most impactful method is through design. The earlier this is done in the development process, the more the potential gains. It’s important to always question technical decisions, but not at the expense of user experience or performance. Respectfully ask your teams why parts, processes, or design choices are truly necessary. Try to reduce complexity without compromising the product. Here are some real examples:
Mechanical:
Once I saved $700K+ on a product by negotiating with a director to remove a component which (in my humble opinion) was dated and unnecessary for customers. The team was reluctant because there was friction in updating the tooling. The real reason, however was the usual “that’s how we’ve always done things”.
Electrical:
In another instance we managed to save $3M+ on a product line by simply asking our engineering team why we were using a certain processor when the use case required something simpler. The reason for the overkill chipset was that it was the standard across the team for a family of product lines, and no one wanted to do the work to migrate to another design, codebase, and supplier.
Other ways to reduce BOM are through design for manufacturing/assembly studies and supply chain negotiations. Having a good global supply manager on your team is invaluable to help with supplier selection, purchase consolidation, bulk discounts, and dual sourcing. For any GSMs reading this, let us know some tips in the comments of how you’ve managed to save costs.

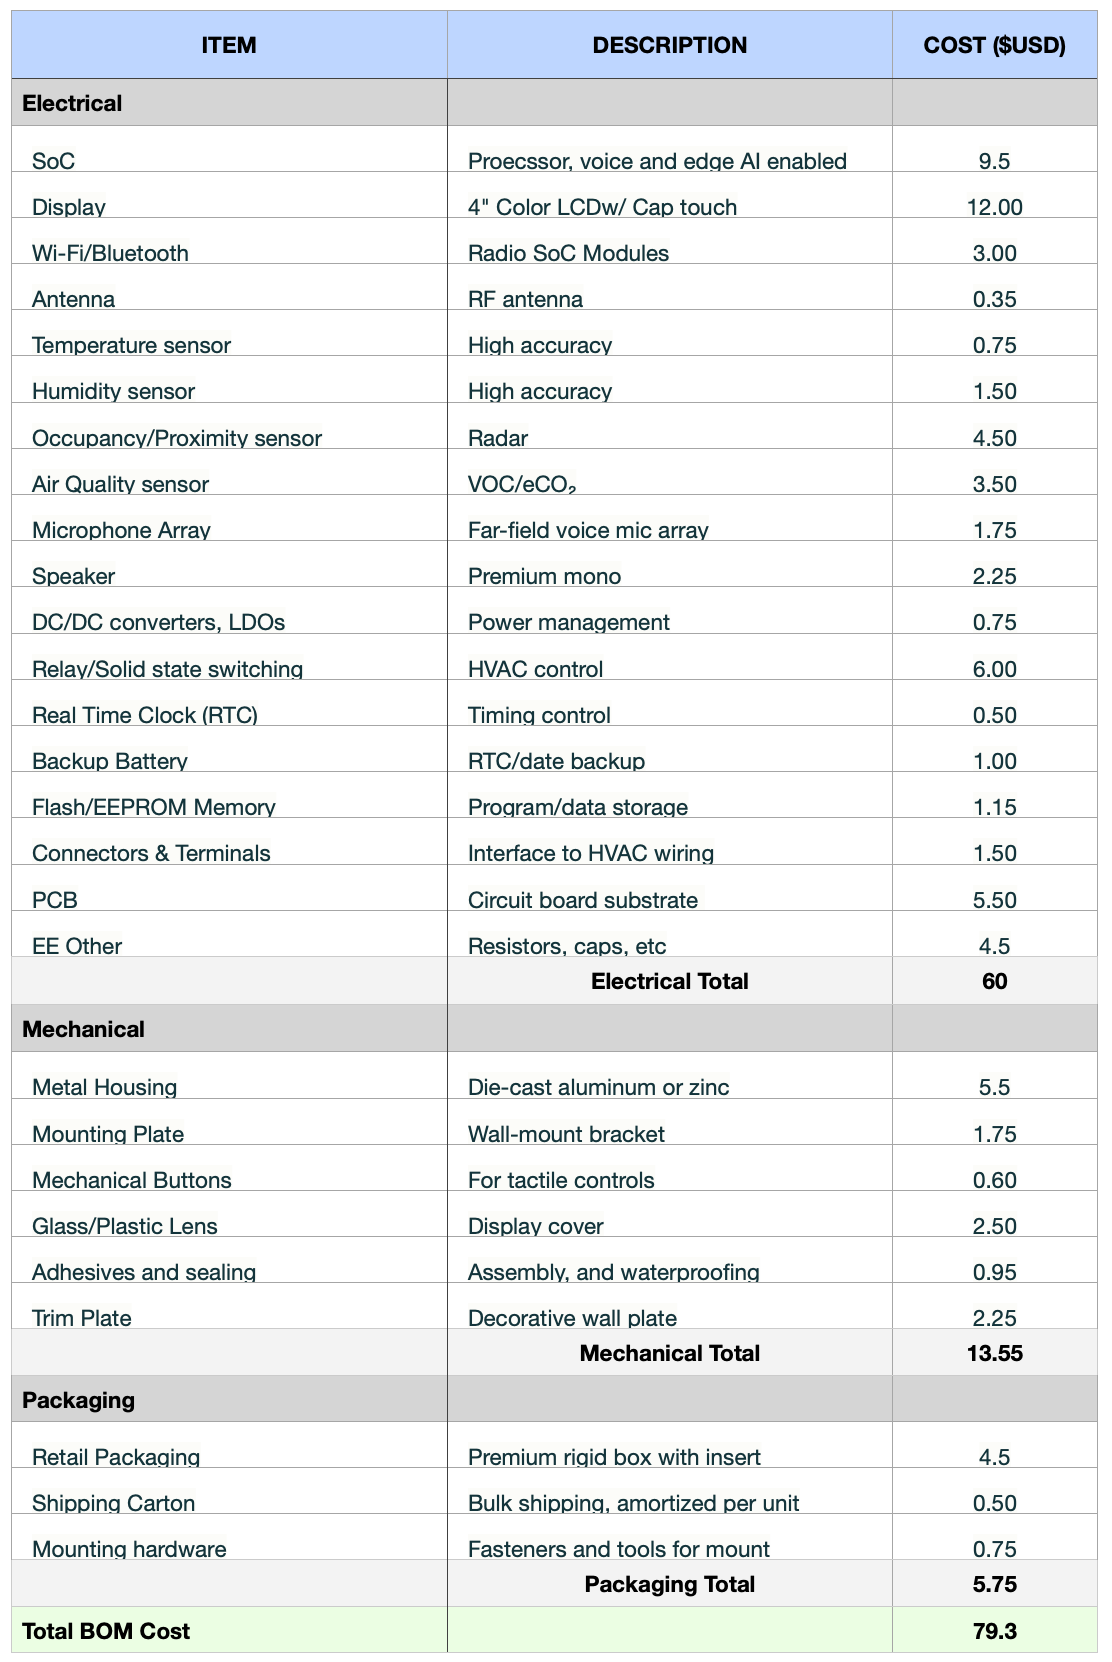
Back to the example, the picture above is what a draft BOM would look like for our premium smart thermostat. Notice how the most expensive components are the display, chipset, and sensors.
Step 7: MVA Cost (Part of COGs)
MVA stands for Manufacturing Value Added. It encapsulates the additional costs to transform raw materials into finished goods. The largest chunk of MVA is usually labor. Other components include repair or scrap material costs. Labor refers to the folks who will be assembling, testing, quality checking, and packaging our product at the contract manufacturer.
MVA is another reason why I’m such an advocate of being on the factory floor. Doing so can really help simplify processes and save costs. I’ve had instances in the past where a supplier quoted me 10 headcount for a sub-process. Once I got to the factory overseas, observed them performing the process, I realized it could be done in half the time. We then re-did the assembly together, and they agreed.

Note, however, that cutting headcount may have a larger impact as factory workers overseas may come from rural areas and depend on these jobs. If you are in a position to optimize costs, try to ensure there’s another station or product that those workers can go to. Contract Manufacturers will usually quote a % of the BOM (5-15%) for MVA costs. For our example, let’s use 8%.
Step 8: Remaining COGs
There are some more costs associated with COGs.
Tariffs
Taxes for importing from certain countries, usually a % of the BOM.
Shipping
Inbound (from factory to a warehouse)
Is usually a flat amount per unit and depends on the size/weight of the package. For smaller devices, we can expect $0.2-3/device. It also depends on the shipping mode. The usual method is ocean shipping, with air tansport being used in a time crunch.
Outbound shipping (warehouse to customer)
These costs are driven by carrier rates, geography, and speed. They are higher than inbound costs. We can expect $3-$12 per unit for smaller devices.
Warranty
This covers the labor, service center processes, and parts to honor the warranty to the customer. It is usually 1-5% of the BOM.
Returns
Includes the refurbishment, inspection, or repacking of returned units. It is usually 5-15$ of the ASP.
Royalties
Licensing fees to use specific algorithms (codecs, wireless standards, etc.). These are usually 0-5% of ASP.
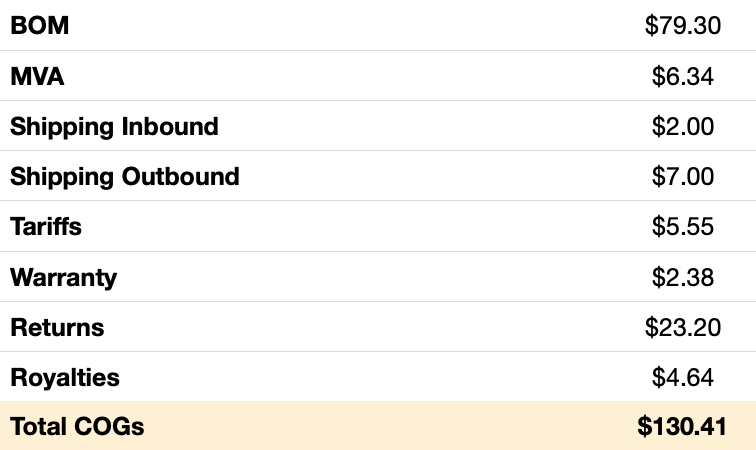
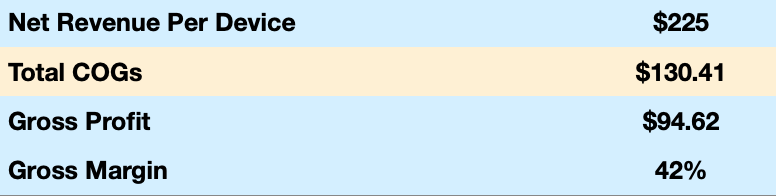
Step 9: Gross Profit Per Device
Gross Profit per Device = Net Revenue per Device − Total COGs
GP = $225 − $130.41
GP = $94.62
Gross Margin (%) = Gross Profit per Device / Net Revenue per Device × 100
GM = ($94.62 / $225)× 100 = 42%
Note that this is a relatively high gross margin. Also note that these margins are further eroded in net profit calculations.
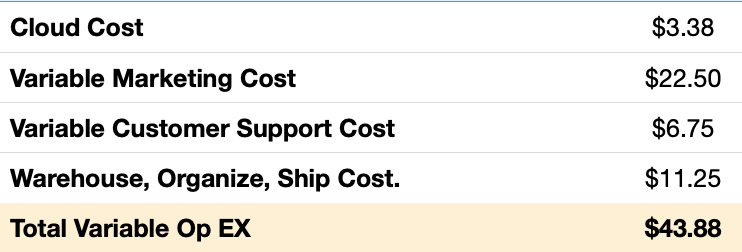
Step 10: Operating Expenses
Thought COGs were the only costs in product making? There are more. Below are some variable operating expenses.
Cloud
The amount of money to run products on cloud infrastructure like AWS, Google, etc. Its typically 1-3% of the ASP.
Marketing
This is marketing spend that scales with each unit sold, such as digital ads, affiliate payouts, referral incentives, and more. Don’t confuse this with CAC (customer acquisition cost) or fixed brand campaigns and salaries. It’s typically 5-15% of the ASP.
Customer Support
The cost to answer customer queries to guide them through setup or performance issues for each unit. Typically 2-5% of ASP.
Warehouse/Shipment
The cost of warehouse handling, outbound shipping, and delivery. Typically 3-7% of ASP
Step 11: Subscription Revenue
I don’t like subscriptions. Products used to be designed for long-term use. Then they were designed for obsolescence. Now, it feels like they’re designed to extract even more from customers through subscriptions.
But to counter my bias, hardware products are extremely challenging to make at scale, and they have lower margins versus their software counterparts. Most carry a high risk for business viability. From a leadership or investor perspective, subscriptions are one of the easiest way to mitigate these risks. From their POV, if additional value is being provided to customers, then it makes sense to augment the base price with a monthly fee.
There are many nuances to calculating subscription revenue, but to keep it simple for our thermostat, let’s assume the monthly subscription price is $10, with a 30% adoption rate. Our effective subscription revenue per device sold is $36.
Notice how we just added $36 per device in revenue. This is significant for life time value calculations.
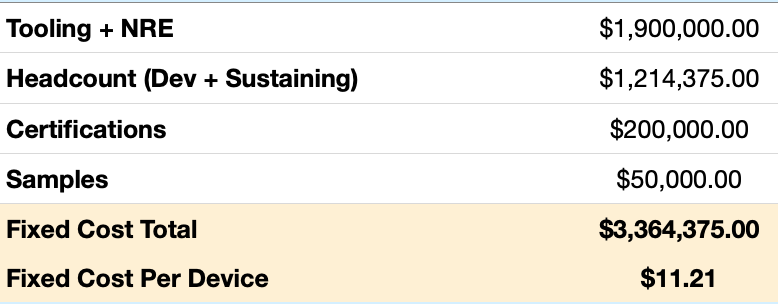
Step 12: Fixed Costs
Thought COGs and operating expenses were the only costs in product making? Think again. Fixed costs can be considered as the initial investment required to launch a new product.
12.1 Headcount
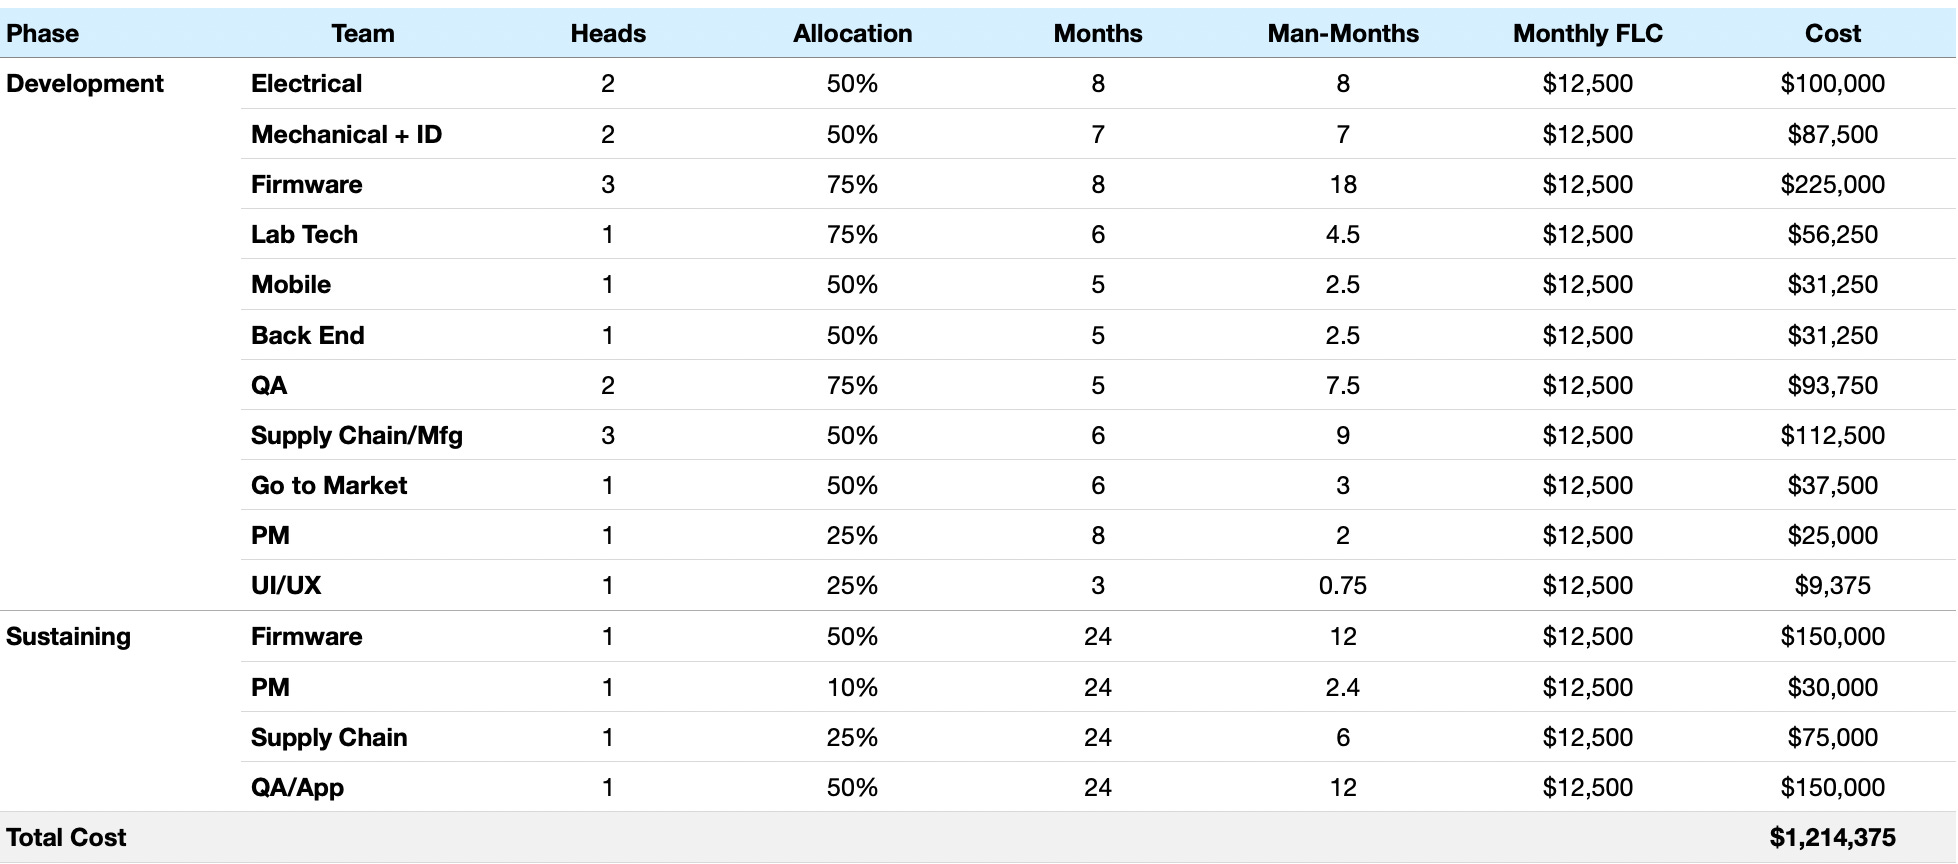
This is the team needed to create our product. Make sure to account for both development resourcing (during design) and sustaining (after the device launches).
The table below represents an example breakdown for our smart thermostat.
Allocation is the percentage of their time spent on the program, as employees typically work on more than one thing. Months are the amount of time needed. Man-months is a product of these two and FLC/”fully loaded cost” is salaries plus benefits. Let’s assume an annual FLC of $150K for the team to keep the example simple.
12.2 Tooling + CM NRE
The cost of injection mold tools, test equipment, assembly fixtures, automated machinery, and more to build the product from the prototype stage to mass manufacturing ramp. CM NRE is non-recurring engineering, or the cost of one-time R&D activities from the contract manufacturer.
12.3 Certifications
The cost to ensure our device complies with regulatory, safety, and market entry requirements. These are typically divided into standards for wireless, environmental, and electrical categories. They also vary by which region the device needs to be sold in. Testing is done in 3rd party labs, usually at the DVT phase of a program.
12.4 Samples
Samples from the factory for design, engineering, or marketing activities.
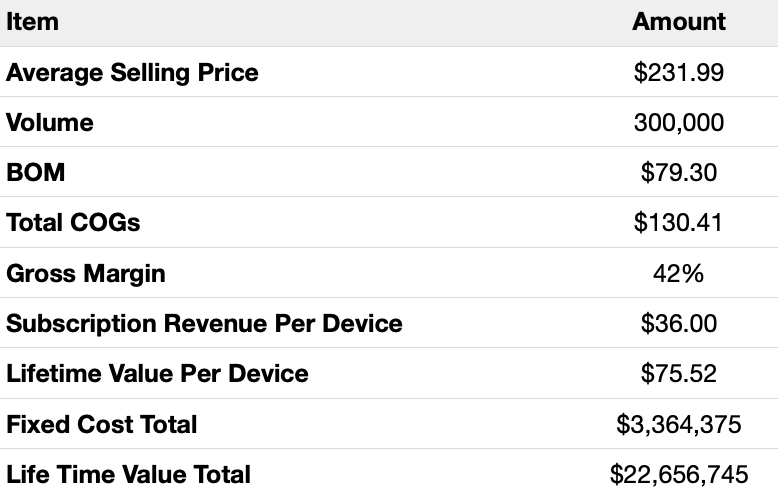
Step 13: Life Time Value
LTV is one of the most important financial metrics for any business. In our context, it means the total return we can expect from a single customer during the time they own a device.
Note, all values in this formula are per device
Life Time Value = Net Revenue + Subscription Revenue − COGs − OpEx − Fixed Cost
LTV = $225 + $36 − 130.41 − $43.88 − $11.21
LTV = $75.52
What’s a good LTV to aim for? It depends on the business, product line, and leadership goals. LTV is usually:
70-90% of MSRP for entry-tier devices
50-70% of MSRP for mid-tier devices
30-50% of MSRP for premium-tier devices
So how’d we do? Ours is 30% of MSRP, which is on the lower end of products in the premium category. Remember the point about why leadership and investors love subscription models for physical products? This is one of the reasons why. One of the easiest ways to increase LTV is to increase subscription costs. Going from $10/mo to $15/mo increases our LTV from $75.5 to $84.5.
Summary
There isn’t a one size fits all approach to developing financial models. Each organization may focus on different metrics. Some like looking at margins, others at LTV/device, and some at fixed costs. Our model is pretty optimistic, as our fixed costs seem low compared to the total LTV. Usually, they’re about half. If this were a real scenario, it would make me go back and re-look at NRE, tooling, and staffing costs to make sure we haven’t missed anything. It’s always better to assume the worst case and be conservative with numbers.
Financial models are nuanced and should be refreshed with every major phase of the program. Suppliers may provide updated material pricing, tariffs rates may change, or design modifications may take shape. How do you guys develop models? Leave your tips in the comments below.
HW Startup Financial Models
As noted in the intro, this post was painting a hypothetical scenario for a medium sized company. Startup financial models have their own challenges. It can take a while to raise capital. There’s also the stress of having enough cash flow to buy inventory. Here are some resources for physical product startups:
Interested in more resources for HW PMing?

In addition to our articles on Substack, we offer tailored services in HW PM career growth and HW product development from idea to launch.
Thanks for reading
Make sure you check out some other articles:
Flagged this for the next issue—very useful!
This is gold! I want to start working on the business model for my robotics startup next week and this is such a fantastic starting point. Thanks for creating it ❤️